Apply with Scoir
Applicant resources
For Students: How to Apply Coalition with Scoir
Transfer & Non-Scoir Students: How many recommendations do I need?
Transfer & Non-Scoir Students: Requesting transcripts, application documents, & recommendations
Transfer & Non-Scoir Students: My recommendation was submitted but the college portal says it’s not received
Transfer & Non-Scoir Students: I added my recommender as "Other" and can't assign their letter to a college
Transfer & Non-Scoir Students: My recommender or school official can’t access their submission link or didn't get an email
Colleges resources
For Colleges: Scoir application activation checklist
For Colleges: Configuring your application
For Colleges: Application activation
For Colleges: Importing School Reference IDs
For Colleges: Testing your application
Recommender & supporter resources
Counselors
Getting started
Using Scoir: A quick start guide for middle school counselors
For Counselors: Managing your account
Counselor Dashboard Overview
For Counselors/Teachers: Changing your email address
For Counselors: Creating a Demo Student Account
Adding & managing students
For Counselors: Student roster overview
For Counselors: Add a new student
For Counselors: Student registration process
For Counselors: Labels overview
For Counselors: My student has a Scoir account but I can't see their data
For Counselors: Edit student profiles
For Counselors: Student transferring high schools
For Counselors: How to Find and Restore Archived Students
Counselors: Recording Scholarships for Students
For Counselors: Create and manage Saved Views
Managing parents
Why can't parents see Scattergrams, Surveys, and other Scoir features?
For Counselors: Using the Parent Roster
Counselors: Why can’t I add a parent to a student’s account?
College & career planning
Common App™ in Scoir
Scoir + Common App Integration – FAQ
Counselors: Using Scoir with Common App
Counselors: Sending Documents for Alumni with the Common App Integration
Counselors: Managing Fee Waivers for Common App
Creating Midyear Reports When Using the Common App Integration
Counselors: Optional Reports for Common App
Counselors: Managing Common App Early Decision (ED) Agreements in Scoir
For Counselors: Creating & Sending a Final Report with the Common App Integration
Common App System Refresh: What to Expect in Scoir
Students: Connecting Common App & Scoir
For Counselors: Viewing students’ career interests
Counselors: PrinciplesYou character assessment overview
For Counselors: Searching and filtering colleges
For Counselors: Suggesting colleges
For Counselors: Add a college to a student's college list
For Counselors: Manage colleges on behalf of a student
For Counselors: Managing and using Scattergrams
For Counselors: Understanding List Scores
For Counselors: A guide to Predictive Chances with Scoir AI
For Counselors: Guide to Acceptance Likelihood and Intelligent Match
For Counselors: Set student outcomes and post-graduate plans
For Counselors: Applications Overview
For Counselors: Admission Intelligence FAQ
For Counselors: Adding a college that isn't showing up in Scoir
Document management
School Drive & student Drives
Choosing the right way to share resources with students
For Counselors: Using School Drive
For Counselors: View and manage your student's Drive
For Counselors: Bulk add files & links to students' Drives
Document preparation & uploading
For Counselors: Manage application materials
Counselors: Create a Secondary School Report for Individual Students
Counselors: Midyear Reports and Transcripts
For Counselors: Final Reports and Transcripts
For Counselors: Grade Reports (Individual)
For Counselors: Application Fee Waivers
For Counselors: Digitally Signing Early Decision Contracts/Agreements
For Counselors: A Guide to Letters of Recommendation in Scoir
Counselors: Complete a counselor evaluation/recommendation
Counselors: Checking the status of teacher recommendation requests
Counselors: Uploading recommendations on Behalf of Others
For Counselors: Managing FERPA on behalf of a student
Understanding FERPA - Frequently asked questions
Counselors: Ranking a Student's Recommendations
Document sending
Counselors: Bulk Sending Application Documents
For Counselors: Sending Application Documents for Individual Students
For Counselors: Understanding what "Complete Packets Ready to Send" means
For Counselors: Understanding the "Needs Attention" document status
For Counselors: Cancel sent documents - the send docs "undo" button 😮
For Counselors: Resending an updated transcript after it was already sent
For Counselors: Why aren't documents appearing in the list to be sent to colleges?
Tracking & troubleshooting
Plans, Tasks, and Forms
For Counselors: Creating and Managing Assignment Plans
Counselors: Creating and Assigning Forms
Counselors: Creating and Assigning Tasks
For Counselors: Creating, publishing, and editing Surveys
For Counselors: Viewing Survey results
For Counselors: Creating brag sheets in Scoir
Counselors: Scoir-Created Plans Playbook
Uploading test scores & other data
Test Score Imports: ACT score imports
Test Score Imports: ACT and PreACT scores via rapid manual entry
Uploading College Board test scores
For Counselors: Importing Custom Properties
Bulk add/update Grade Report
Bulk add/update Senior Courses
Bulk add/update Student GPAs
Bulk add/update Transcripts
Reporting
For Counselors: Running reports on student data
For Counselors: Custom Properties and Property Groups
Communication & notifications
For Counselors: Messaging students & parents in Scoir
For Counselors: The Email Center
For Counselors: Sending and scheduling emails
For Counselors: Emailing users using the advanced email integration
For Counselors: Scoir Library & Email Subscription management
For Counselors: What notifications will students receive from Scoir?
For Counselors: Notifications & alerts
Calendar & scheduling
Using the calendar
For Counselors: Calendar overview
For Counselors: Linking your Scoir calendar to an external calendar
Visits & office hours
For Counselors: Scheduling in-person visits & availability
For Counselors: Scheduling virtual visits
For Counselors: Scheduling visits for non-college organizations
For Counselors: Scheduling multiple college visits within the same time slot
For Counselors: Students' notification of college visits
For Counselors: Understanding Scoir RSVP dates
For Counselors: Scheduling office hours
For Counselors: Office hours from the student perspective
For Counselors: Edit or delete a visit
Resources & checklists
Students
Account setup & management
Students: Getting Started with Your Scoir Dashboard
For Students: Creating an account when invited by your high school
For Students: Creating an account on your own (non-Scoir high school student account)
For Students: How to tell if you are linked to a high school or not
For Students: Invite a parent or guardian to Scoir
For Students: What to do if you have multiple accounts
Students: Link your existing Scoir account to a high school
Students: How to Add an Alternate Email or Change Your Primary Email
For Students: Delete your account
Build your student profile
For Students: Updating Your Personal Information in Scoir
For Students: First generation students
Students: How to Access and Sign Your FERPA in Scoir
For Students: Edit Your Academic Info (School, GPA, and Test Scores)
For Students: Record Your Activities and Achievements
For Students: Create and Export a Resume in Scoir
For Students: Using your Drive
Explore careers
For Students: Taking a career interest assessment
For Students: Taking the PrinciplesYou character assessment
For Students: Discover careers
For Students: Managing careers in your profile
For Students & Parents: Access College Guidance Network with single sign-on (SSO)
College planning
Explore colleges
For Students: Setting your college preferences
For Students: Student interest categories
For Students: Discover colleges
For Students: College profiles
For Students: Comparing colleges
For Students: Viewing Scattergrams
For Students: Discover Events
For Students: Discover Programs
Build & manage your college list
For Students: Understanding what it means to follow a college in Scoir
For Students: My Colleges
For Students: View your college list in a table layout
For Students & Parents: Create and Manage Views
The Balanced List Score
For Students: View & simulate your Predictive Chances for college admissions
For Students: Updating outcomes and post graduate plans
Students: How to Sign your FERPA in Common App
Application documents & resources
For Students: Understanding Test Optional, Test Free & Test Required SAT/ACT Scores
Students: Requesting Application Fee Waivers in Scoir
For Students: Early Decision Contracts in Scoir
For Scoir connected students: Requesting transcripts
Students: Requesting Teacher Recommendations if Your School Uses Scoir
For Students: Checklist for ensuring application document delivery
Students: Using Scoir & Common App if Your School Doesn't Connect Them
Students: Requesting Fee Waivers for Common App
For Students: How to Request and Rank Recommendations
Students: Completing an Early Decision (ED) Agreement for Common App
Students: Getting Started with Scoir & Common App
Assignments
Office hours & visits
Students: Registering for Office Hours with Your Counselor
For Students: Registering for college visits
Scoir mobile app
College Admissions
Staff setup & management
For Colleges: Add & invite admissions staff
For Colleges: Admissions Officer Roles & Permissions
For Colleges: Remove admissions staff
Integrating Slate with Scoir
Introduction: Integrating Slate with Scoir
Step 1: Prepare Slate to Receive Data and Documents from Scoir
Step 2: Connect Slate and Scoir
Step 3: Map Scoir Student Data and Documents in Slate
Troubleshooting Slate integration with Scoir
Colleges: Scoir Audience Integration with Slate
Applications & documents
Application rounds & requirements
Understanding Application Rounds in Scoir
Creating Application Document Requirements
Creating an Application Deadline
For Colleges: Editing, copying, and deleting Application Requirements
Receiving documents
For Colleges: Scoir Index File
For Colleges: Set up a Manual SFTP Connection with Scoir
For Colleges: Troubleshoot configuration of SFTP integration with Scoir
For Colleges: Slate Mapping
For Colleges: Supported Document Types
For Non-Slate Colleges: Configuring File Preferences
For Colleges: Downloading & reviewing documents
For Colleges: Grade Reports
For Colleges: The Scoir CSV/Manifest file
For Colleges: How to access student application documents in Scoir
Managing college profile content
Colleges: Premium Presence Overview
Colleges: How to Use Posts, Events, and Programs in Premium Presence
For Colleges: Events
For Colleges: Guidelines for college profile header photos
Student & guardian messaging
Colleges: Outreach Messaging Overview
Colleges: Sending One-Time Outreach Messages
Colleges: Setting Up Automated Outreach Messages
Find high schools & schedule visits
For Colleges: Explore High Schools & Schedule Visits with Visits+
For Colleges: Getting Started with Visits+ Premium
Colleges: Managing Your Institution's High School Visits
For Colleges: Linking to an external calendar
Student interest & insights
District Administrators
For District Admins: Logging into your Network account
For District Admins: Getting started with a Network account
For District Admins: Adding and managing users in your Network account
For District Admins: Network roles and permissions
For District Admins: District communications
For District Admins: Setting up and enabling Advanced Email features
School Administrators
School account setup: Data requirements
Grades 9-12
Grades 9-12: Scoir data gathering instructions (Naviance & SIS for students, parents, and teachers)
Grades 9-12: Scoir data gathering instructions (Naviance, ClassLink & SIS for parents)
Grades 9-12: Scoir data gathering instructions (Naviance, Clever & SIS for parents)
Grades 9-12: Scoir data gathering instructions (ClassLink & SIS for parents)
Grades 9-12: Scoir data gathering instructions (Clever & SIS for parents)
Grades 9-12: Exporting data from your Student Information System (SIS)
Grades 6-8
Grades 6-8: Exporting data from your Student Information System (SIS)
Grades 6-8: Scoir data gathering instructions for account setup (Clever)
Grades 6-8: Scoir data gathering instructions for account setup (ClassLink)
Grades 6-12
Grades 6-12: Scoir data gathering instructions (ClassLink & SIS for parents)
Grades 6-12: Scoir data gathering instructions (Clever & SIS for parents)
Grades 6-12: Scoir data gathering instructions (Naviance, ClassLink & SIS for parents)
Grades 6-12: Scoir data gathering instructions (Naviance & SIS for students, parents, and teachers)
Grades 6-12: Exporting data from your Student Information System (SIS)
Grades 6-12: Scoir data gathering instructions (Naviance, Clever & SIS for parents)
System-Specific Instructions
School account settings
School Settings Overview
Enable application materials (Documents)
Setting up and enabling Advanced Email
Ensuring Scoir Emails are Delivered
Request a GPA scale change
Set Up Your School Reports Template
Managing Student Transcript Settings
Configuring FERPA Waiver & Release Forms
Configuring Recommendation Settings
School logo and template for teacher recommendations
Student self-reporting for GPA and test scores
Pending Acknowledgement
Predictive Chances and Scattergram display settings
For Counselors: Overriding a college's application document requirements
Can counselors control who sees Balanced List scores?
Can counselors adjust Balanced List minimums?
Can Balanced List Scores be based on just colleges marked as Applying and Applied?
User setup & roles
Users page overview
Adding and removing counselors and other staff to Scoir
Inviting faculty and staff
Understanding and assigning roles and permissions
Inviting Students
Assigning counselors to students
Inviting Parents/Guardians to Join Scoir
Inform students, families, and staff about Scoir with these templates
For Counselors & Staff: Signing In to Scoir & Multi-Factor Authentication
Data uploads
Parents
Account setup & management
Parents/Guardians: Managing your email notifications
For Parents/Guardians: Changing your email address
For Parents & Guardians: Getting to Know Your Dashboard
For Parents: How to create and link your account to your student and their school
For Parents/Guardians: Change your Scoir password
Supporting your students
For Parents/Guardians: View your student’s college list
For Parents: View your student’s college list in a table layout
For Parents/Guardians: Suggesting colleges to your student
For Parents/Guardians: Unsuggesting a college for my student
For Parents/Guardians: View and simulate your student’s Predictive Chances
For Parents: View and manage your student’s Drive
For Parents/Guardians: Digitally signing your student's early decision contract
Parents & Guardians: How to Sign the FERPA Release in Scoir
Searching for colleges
For Parents/Guardians: Search and Suggest Colleges to Your Student
For Parents/Guardians: Viewing Scattergrams
For Parents/Guardians: Comparing colleges
For Parents/Guardians: Financial information & estimates
For Parents/Guardians: Discover Programs
Assignments
Scoir mobile app
Teachers
Product Updates
In this article
- Browse by topic
- College Admissions
- Student interest & insights
- Colleges: Explore your Admissions Insights Dashboard
Colleges: Explore your Admissions Insights Dashboard
The Scoir Admissions Insights Dashboard provides a clear view of the students on Scoir who have shown interest in your college and those your outreach efforts have reached.
Below, we’ll walk through the three main sections of your dashboard: Interested Students, Reached Students, and Competitive Insights. Each section helps you better understand your audience and the impact of your brand.
Interested Students
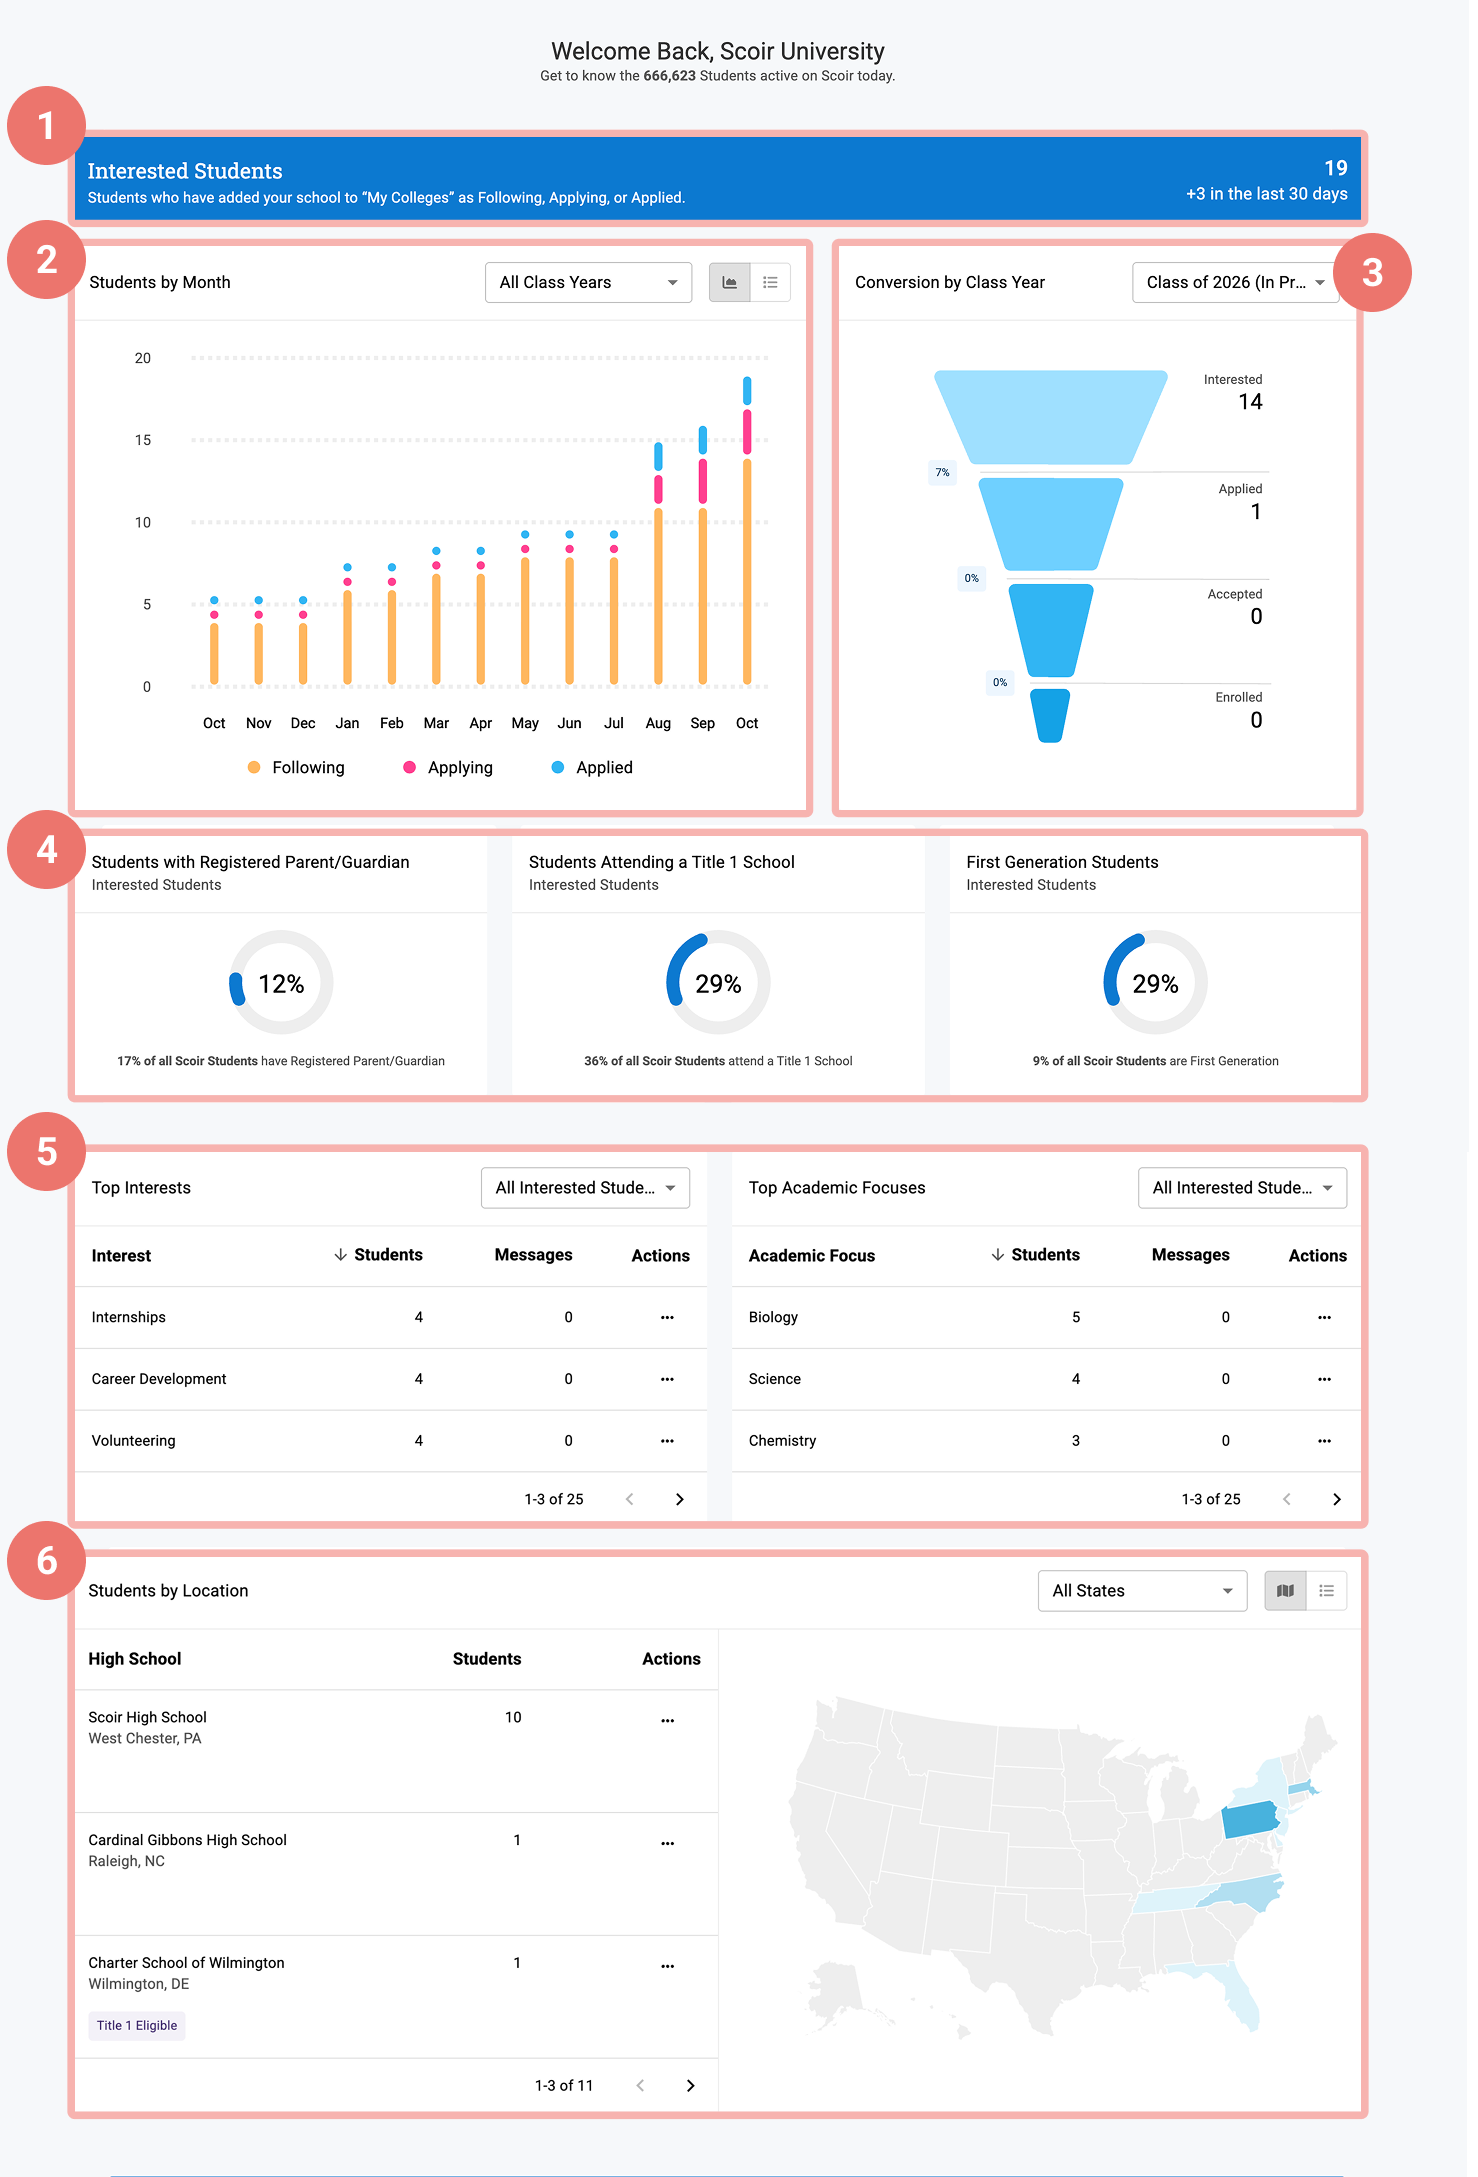
- The Interested Students banner displays the total number of students who have added your school to “My Colleges” as Following, Applying, or Applied, including the number of students who have expressed interest in the last thirty days.
- The Students by Month chart displays an overview of interest growth over a period of months, and can be filtered by class year. Within each month, the number of students who are following, applying, or have applied to your college will be uniquely displayed.
- The Conversion by Class Year funnel displays how students from a particular graduating class move through each stage of the college interest pipeline—from showing interest to applying, being accepted, and enrolling. This visualization helps you track engagement and conversion rates across stages.
- In addition, separate tiles include information about the percentage of students with registered parents/guardians, the percentage of students attending a Title 1 school, and the percentage of students who are first-generation. The blue donut represents the percentage of these students who have specifically expressed interest in your college, while the percentage beneath the donut represents the total percentage of students on Scoir who match this criteria.
- These two tables let you filter your reach according to top student interest and academic focus, along with the ability to message interested students, if you have Outreach Messaging on Scoir and the correct permissions.
- The Students by Location section provides a geographic view of student interest by state, and is aggregated according to high school. This section can be filtered by state if desired. You may also schedule high school visits via this table if you have the necessary permissions to do so by clicking the three dots (⋮) within a high school’s row and selecting Schedule Visit from the menu, which will direct you to the Calendar view in the High School Visits tab.
Reached Students
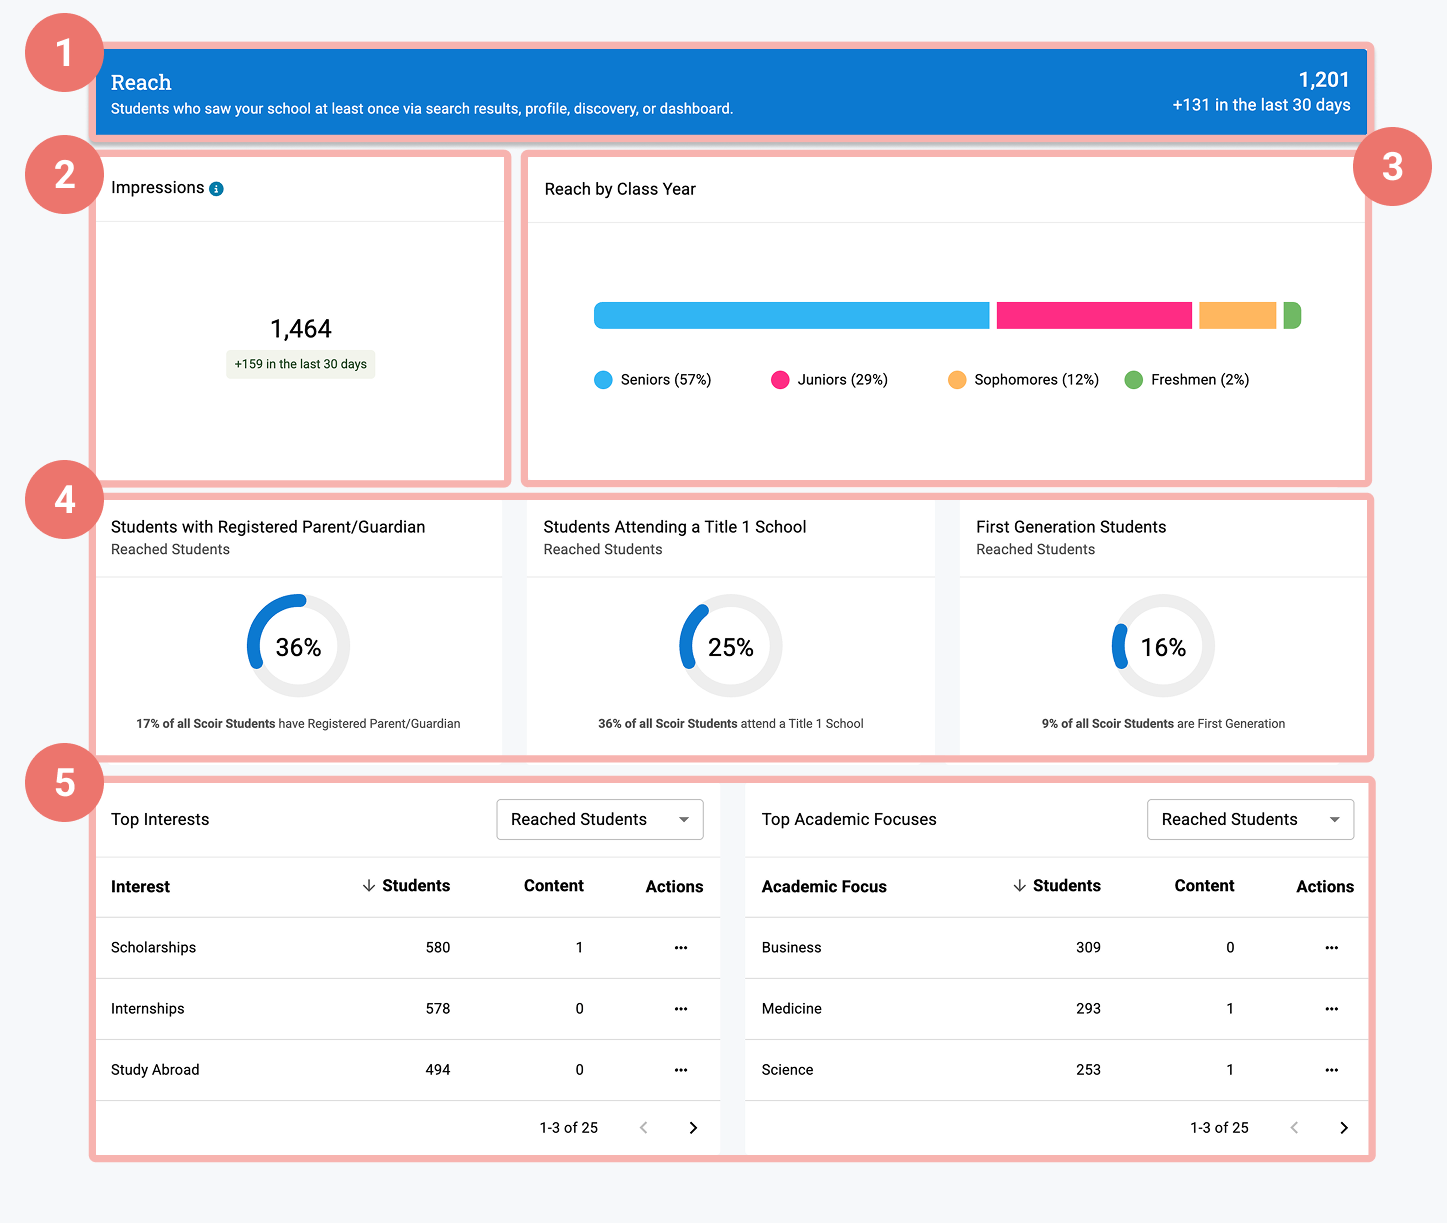
- The Reach banner displays the total number of students who saw your school at least once via search results, profile, discovery, or dashboard, including the number of unique students your brand has reached in the last thirty days.
- The Impressions tile aggregates the number of times your brand has been seen across Scoir by students, and includes impressions from all currently active students on Scoir.
- Reach by Class Year breaks down the total number of unique students that have come across your brand on Scoir by class year.
- There are separate tiles include information about the percentage of students with registered parents/guardians, the percentage of students attending a Title 1 school, and the percentage of students who are first-generation. As with the Interested Students section, the blue donut represents the percentage of these students you have specifically reached, while the percentage beneath the donut represents the total percentage of students on Scoir who match this criteria.
- The Top Interests and Top Focuses tables let you filter your reach according to student interest and academic focus, along with the ability to create new content for each category by clicking the three dots (⋮) within a high school’s row and selecting Create Content from the menu.
Competitive Insights
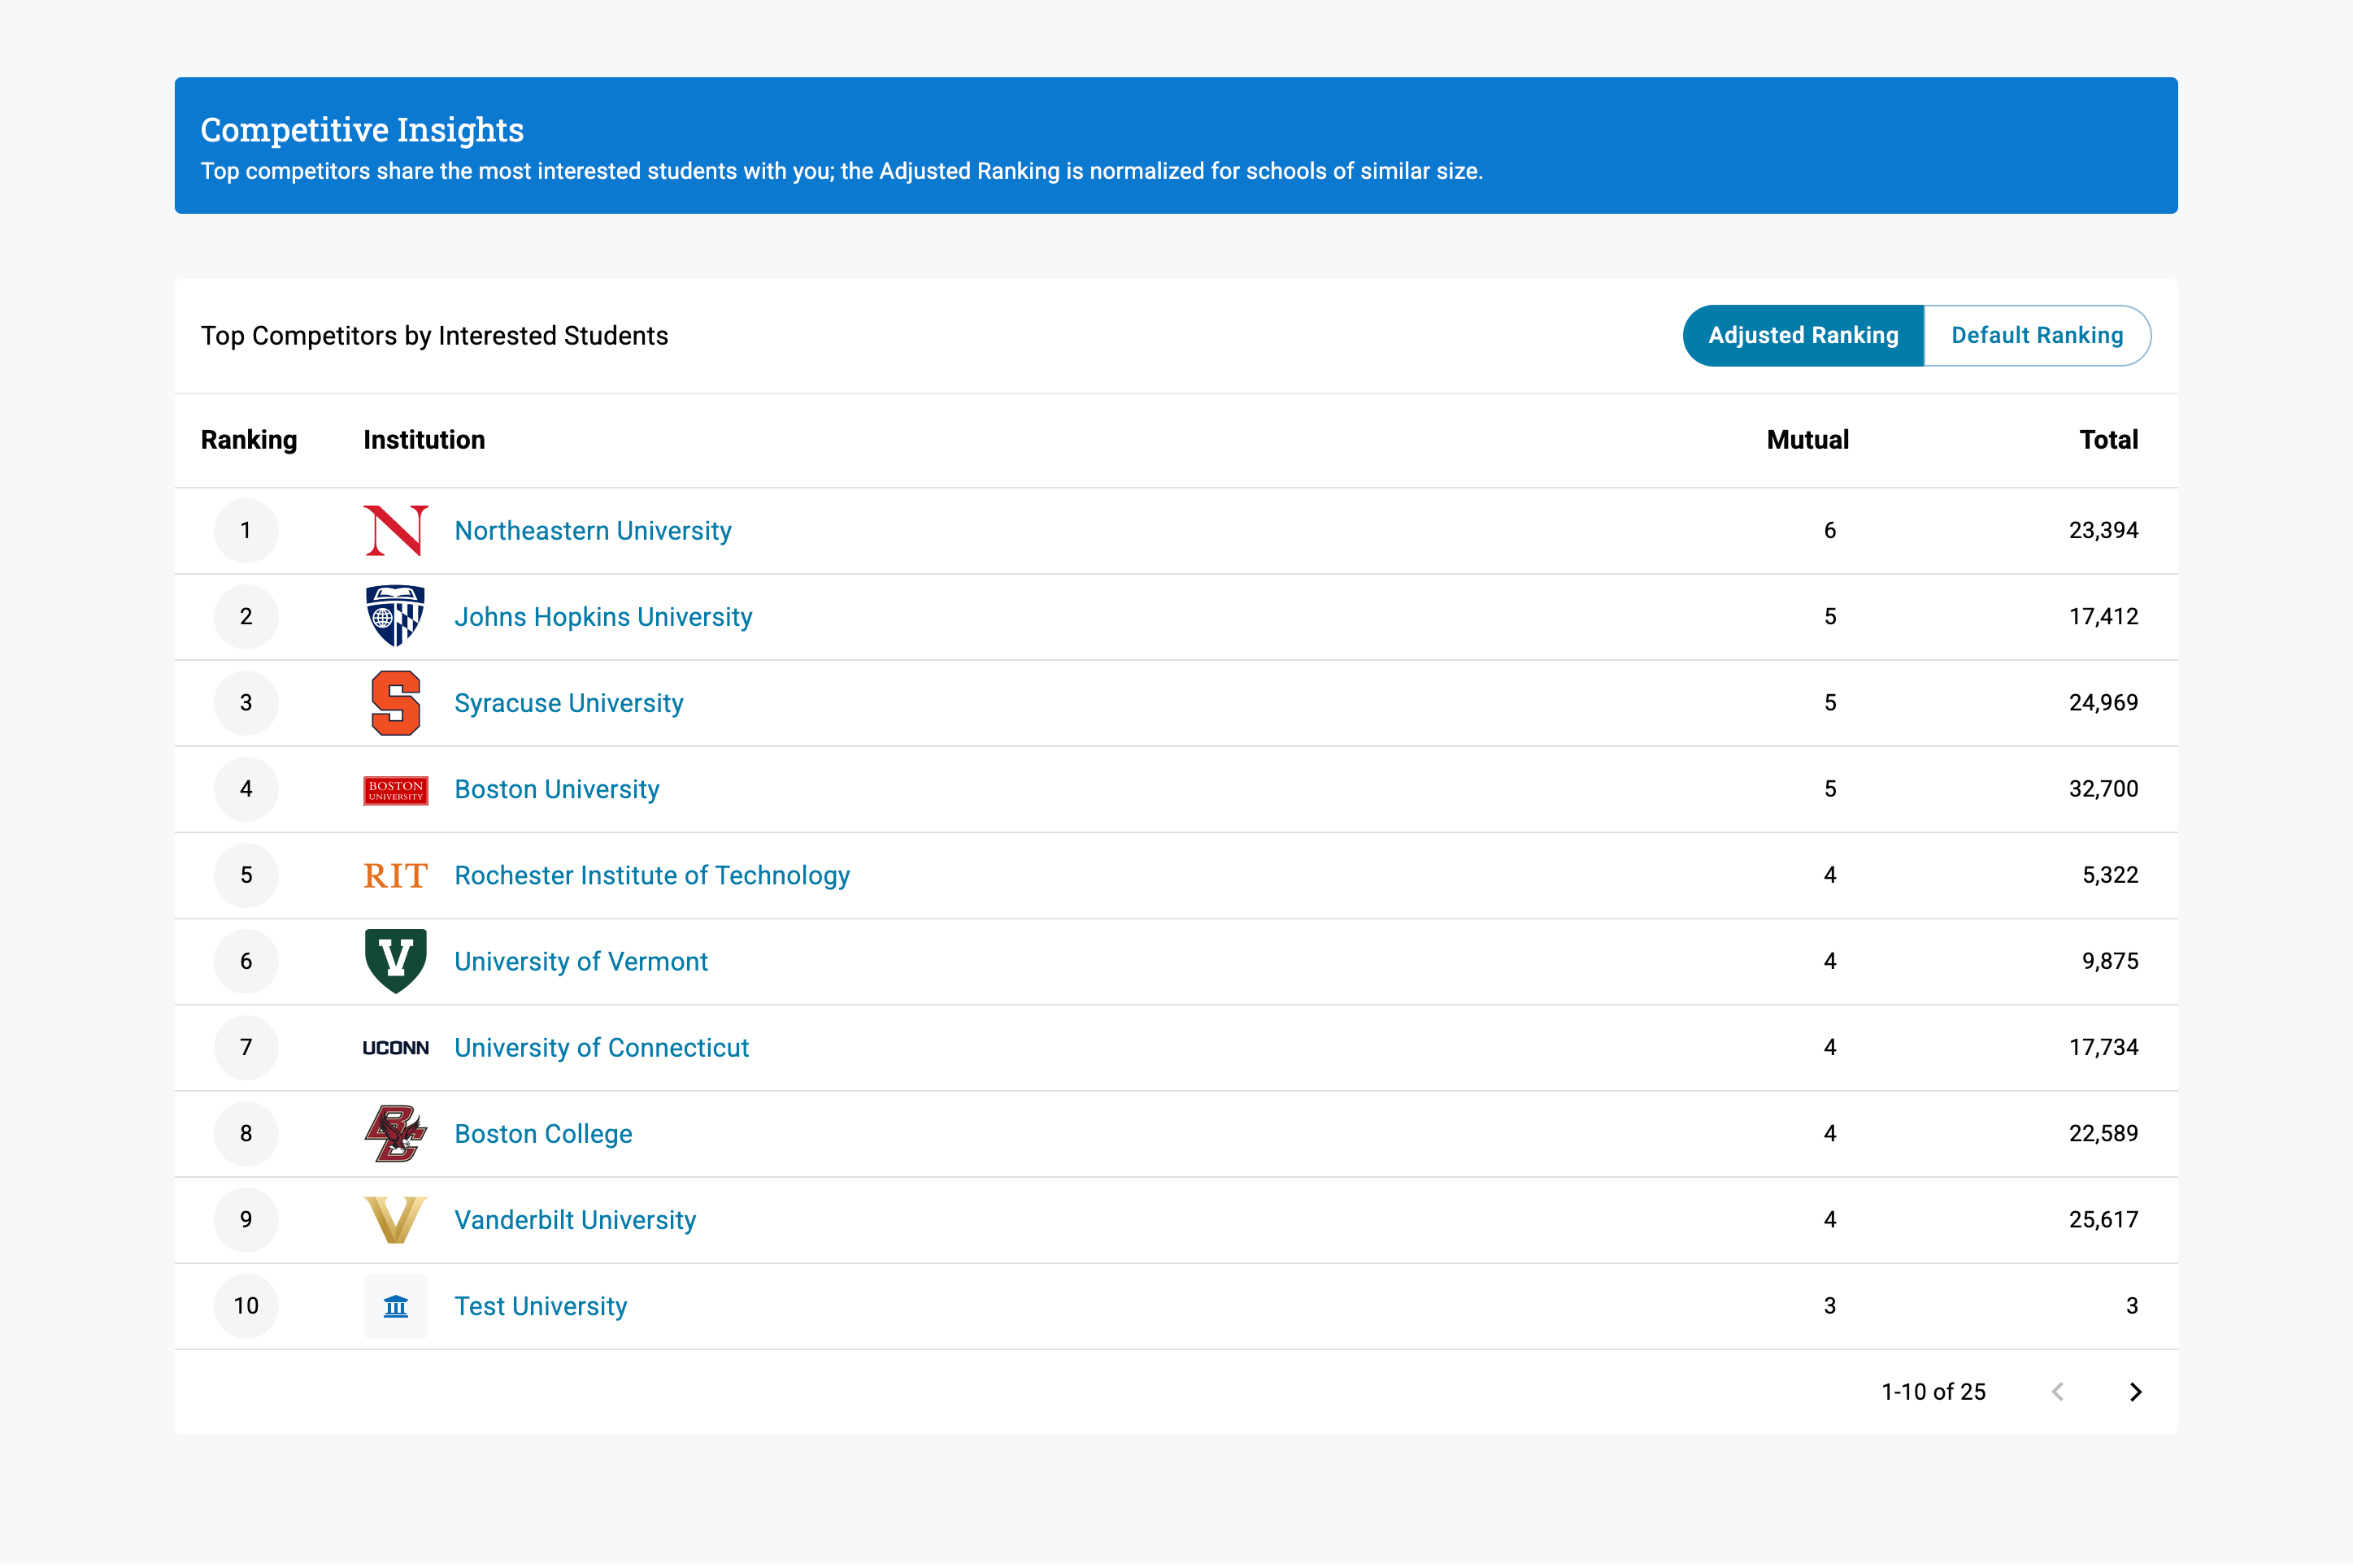
The Competitive Insights section highlights the colleges that share the most interested students with your institution. The Adjusted Ranking normalizes results for schools of similar size, while the Default Ranking shows overall totals.
The table displays each competitor’s ranking, name, the number of Mutual students (students who have shown interest in both institutions), and the Total number of students interested in that college on Scoir. This helps you identify where your prospective students are also engaging and how your reach compares within your peer group.